
Best 5 Stock Trading Dashboards for Smart Investments

The Importance of Dashboards in Financial Strategy: Streamlining Information for Better Decision-Making
In the fast-paced world of finance and investing, making informed decisions is crucial to success. Dashboards have become indispensable tools in achieving this, as they transform complex, raw data into clear, actionable insights. By presenting information visually, dashboards allow traders, investors, and portfolio managers to quickly understand market dynamics, track performance, and refine strategies.
What is a Dashboard?
A dashboard is an interactive, user-friendly interface designed to visualize key metrics and performance indicators (KPIs). It delivers up-to-the-minute insights on various aspects of market activity, including stock prices, market trends, operational performance, and critical business events. In a financial context, this means that investors can access live market data, such as price movements, trading volumes, and asset performance, in a way that simplifies decision-making and enhances strategic planning.
Specifically, in the context of stock investing, it provides real-time access to market information such as prices, trading activity, and trends. This makes it an essential resource for various types of investors:
- Active Traders: These investors rely on live data to make quick, informed buy or sell decisions, enabling them to take advantage of market fluctuations and maximize profit opportunities.
- Portfolio Managers: By using the dashboard, portfolio managers can monitor the performance of different assets in real time, allowing them to optimize asset allocation and adjust investment strategies as market conditions change.
- Financial Analysts: Analysts use the dashboard to track stock performance, spot emerging trends, and provide timely recommendations to clients or investors based on the most up-to-date data available.
- Retail Investors: For individual investors, the dashboard offers instant insights to help them identify trends, act on sudden market shifts, and refine their investment strategies to make better decisions.
How Dashboards Drive Financial Strategy
- Transforming Complex Data into Actionable Insights: One of the biggest challenges in financial markets is dealing with the sheer volume of data. Raw numbers and figures can be overwhelming and difficult to interpret without context. Dashboards address this by turning complex financial data into visual elements—charts, graphs, and tables—that highlight key trends and performance indicators. This makes it easier to see patterns, track performance, and detect anomalies or opportunities.
- Enabling Real-Time Decision-Making: The ability to act swiftly in response to market shifts is critical, especially for active traders. Dashboards offer real-time data, allowing traders to make decisions based on the latest market movements. Whether it's executing a buy or sell order or adjusting a trading strategy, instant access to live data ensures that decisions are timely and based on the most current information.
- Supporting Portfolio Management and Optimization: For portfolio managers and long-term investors, dashboards play a vital role in portfolio monitoring and optimization. Dashboards help track asset performance, evaluate portfolio diversification, and assess risk. By providing a clear view of key metrics like return on investment (ROI), asset allocation, and sector performance, portfolio managers can quickly identify areas that need adjustment or rebalancing to align with their financial goals.
- Tracking Trends and Identifying Risks: Financial analysts rely on dashboards to monitor trends, detect potential risks, and offer strategic recommendations. Dashboards allow for the visualization of market movements over time, highlighting emerging trends and anomalies that might indicate a risk or an investment opportunity. This proactive approach to trend analysis enables analysts to provide data-driven insights, helping investors stay ahead of market shifts.
- Empowering Retail Investors with Confidence: Dashboards aren’t just for institutional traders and portfolio managers—they’re also powerful tools for retail investors. With easy access to real-time data, retail investors can track their own holdings, identify profitable opportunities, and adjust strategies based on emerging trends. The intuitive nature of dashboards ensures that even non-professional investors can make informed decisions without feeling overwhelmed by complex financial data.
- Fostering Collaboration: In larger investment teams or financial institutions, collaboration is key to refining strategies and responding to market changes. Dashboards facilitate collaboration by allowing teams to share live data and insights seamlessly. When everyone has access to the same real-time data, decision-making becomes more coordinated and efficient, ensuring that all team members are aligned on the latest developments.
The Strategic Edge of Real-Time Dashboards
The true value of a real-time dashboard lies in its ability to give users a strategic edge. By consolidating vast amounts of data into one comprehensive view, dashboards enable investors to:
- React Faster to Market Movements: In the world of stock trading, time is of the essence. A real-time dashboard ensures that traders and investors can respond instantly to market fluctuations, making it easier to capitalize on short-term opportunities or mitigate losses quickly.
- Identify Opportunities Before They Become Obvious: Dashboards help investors identify trends and patterns before they become widespread knowledge. Whether it's a potential breakout in stock prices or an emerging sector trend, a real-time dashboard empowers investors to act on information faster than others, giving them a competitive advantage.
- Stay Aligned with Financial Goals: By tracking performance against set benchmarks or goals, dashboards help investors stay focused on their financial strategy. Whether you're aiming for a certain level of portfolio growth or seeking to maintain a specific risk-to-return ratio, the dashboard provides ongoing visibility into your progress and helps adjust strategies as needed.
- Make Data-Driven Decisions with Confidence: Perhaps the most significant benefit of using a real-time dashboard is the confidence it instills in investors. With key metrics and trends at their fingertips, investors can make decisions based on facts and analysis, rather than intuition or guesswork. This reduces the emotional element of investing and leads to more rational, strategic decision-making.
Enhanced Decision-Making with Real-Time Dashboards
Beyond providing immediate insights for short-term decisions, integrating real-time data with stock sentiment analysisallows for better long-term planning. By observing how the market reacts to news and events, investors can better position their portfolios for sustained growth. Dashboards help investors not only react in the moment but also prepare for future trends, enabling strategic portfolio optimization and improved long-term outcomes.
Additional Benefits
- Proactive Problem-Solving
Dashboards help investors identify potential issues or challenges in the market before they impact their portfolios. Whether it's a downturn in a particular sector or a risk to a specific holding, real-time data allows for early intervention. - Improved Cost Efficiency
By automating reporting and data tracking, dashboards reduce the time and effort needed for manual portfolio management. This streamlined approach to financial management helps investors optimize their time and resources. - Data-Driven Decisions
Dashboards foster a strategic mindset by providing instant, actionable insights. By eliminating the need for guesswork, investors can make decisions based on facts and analysis, ensuring that each move is informed by solid data. - Enhanced Customer Experience
For financial advisors or portfolio managers, real-time dashboards offer a way to tailor investment approaches to clients' goals and risk profiles. With up-to-date insights, advisors can offer more personalized, proactive advice that aligns with their clients’ unique investment needs.
Stock Analytics Dashboard Currently in the Market
In today’s fast-paced financial markets, real-time stock analytics dashboards have become essential tools for investors and traders looking to gain a competitive edge. Currently, many platforms offer robust dashboard features that help investors make data-driven decisions. However, each platform caters to different user needs, from active traders looking for detailed technical analysis to investors seeking macro-level market insights. Understanding the unique capabilities of each platform is crucial to selecting the one that aligns best with your investment strategy.
Google Finance
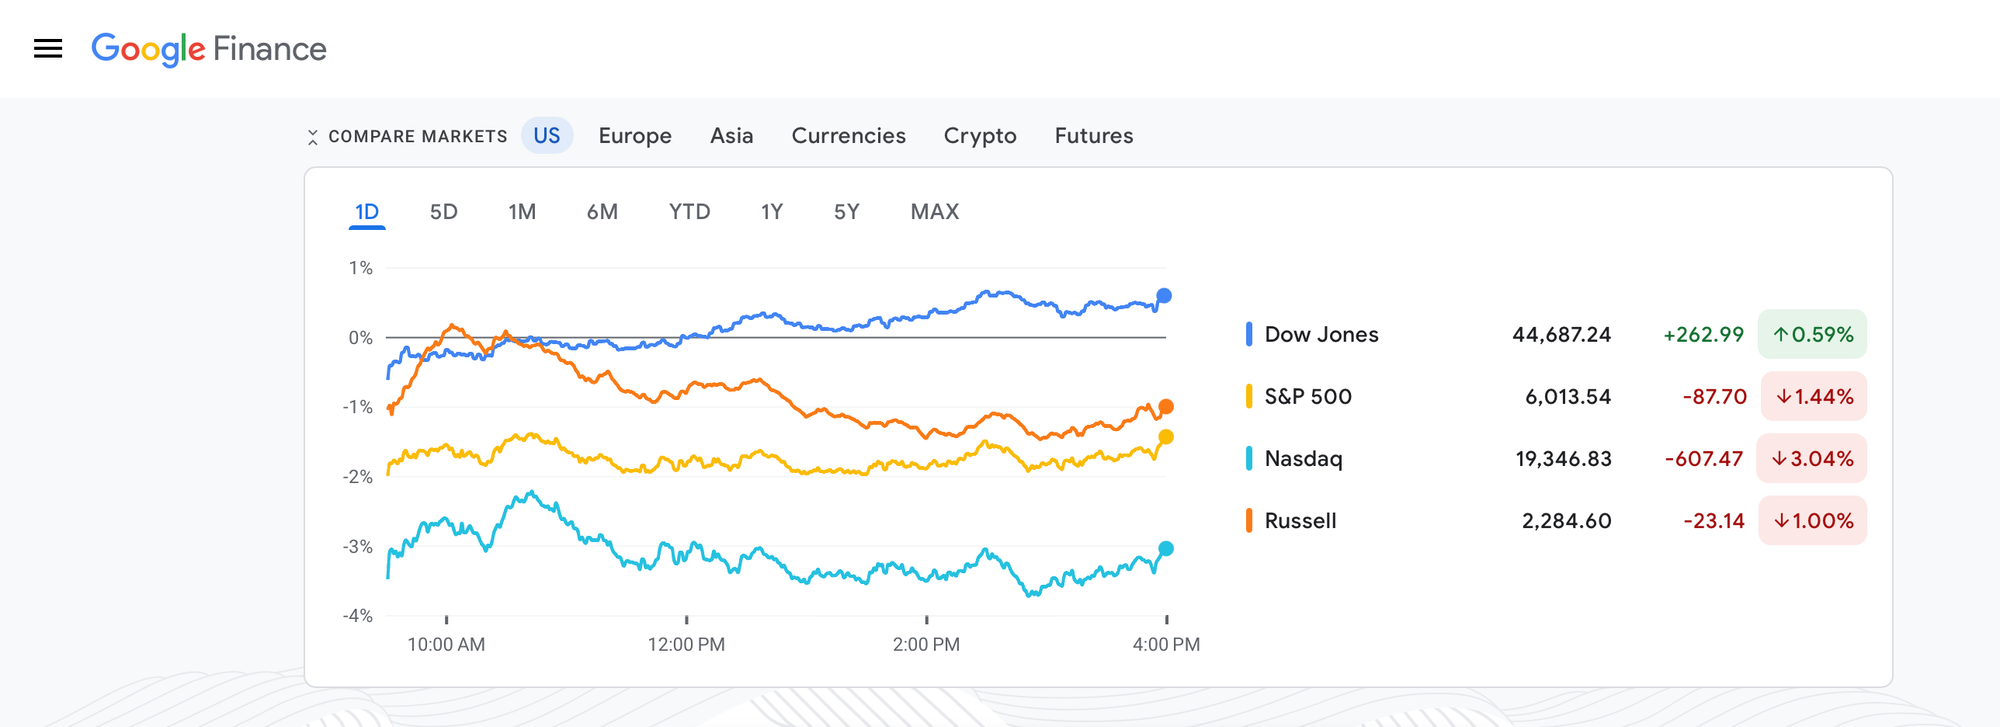
Google Finance provides real-time market quotes, international exchanges, up-to-date financial news, and analytics to help make more informed trading. Get real-time stock quotes & charts, financial news, currency conversions, or track customized portfolio. The two advantages of Google Finance are:
- Free access: Traditionally, many advanced portfolio tracking tools and financial platforms required users to pay for premium features or access to detailed reports. However, the trend toward free access has democratized investing tools, providing retail investors with robust tracking and analysis features that were once only available to institutional investors or professionals.
- Displays customized portfolio balance over time: This feature helps investors understand how their assets are evolving, allowing them to identify trends and areas for improvement.
Tradingview
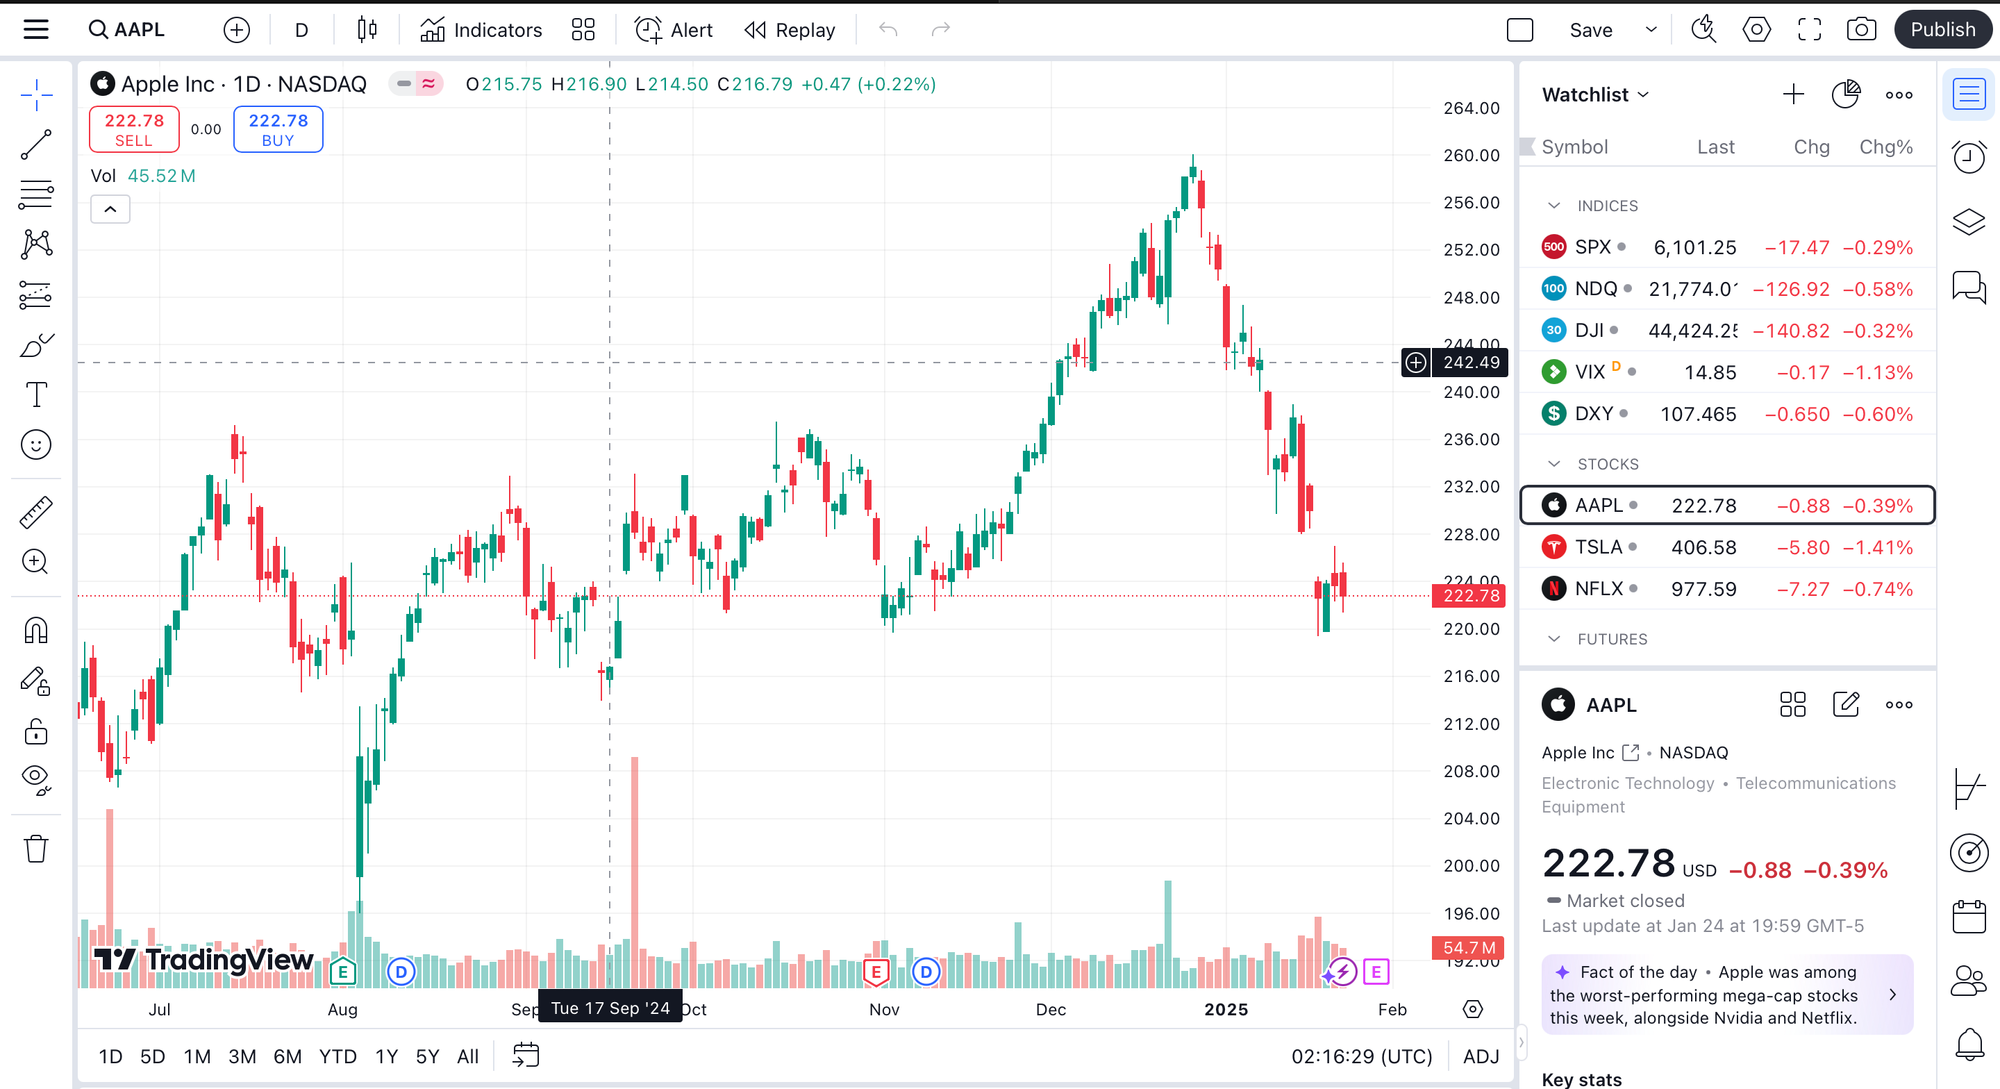
TradingView stands out as one of the most popular platforms for investors and traders due to its wide variety of accessible and powerful dashboards that cater to a range of investment needs. TradingView offers a suite of tools designed to provide in-depth insights and real-time data on stocks, commodities, forex, and cryptocurrencies, empowering users to engage with the markets in an informed and strategic way.
- Detailed Stock-Specific Insights: TradingView provides comprehensive data on individual stocks, including real-time pricing, trading volume, and candlestick charts, which are indispensable for technical analysis. Investors can track price movements over various timeframes, from minutes to years, to better understand stock behavior.
- Watchlist & Alerts: One of the standout features of TradingView is the ability to create personalized watchlists for stocks, sectors, or indices. Traders can set price alerts and receive notifications when certain criteria are met, making it easier to act quickly in response to market movements.
- Ideal for Active Traders: The platform excels in delivering quick, actionable insights for intraday trading, allowing users to evaluate market trends and identify optimal entry and exit points based on price action.
Finviz
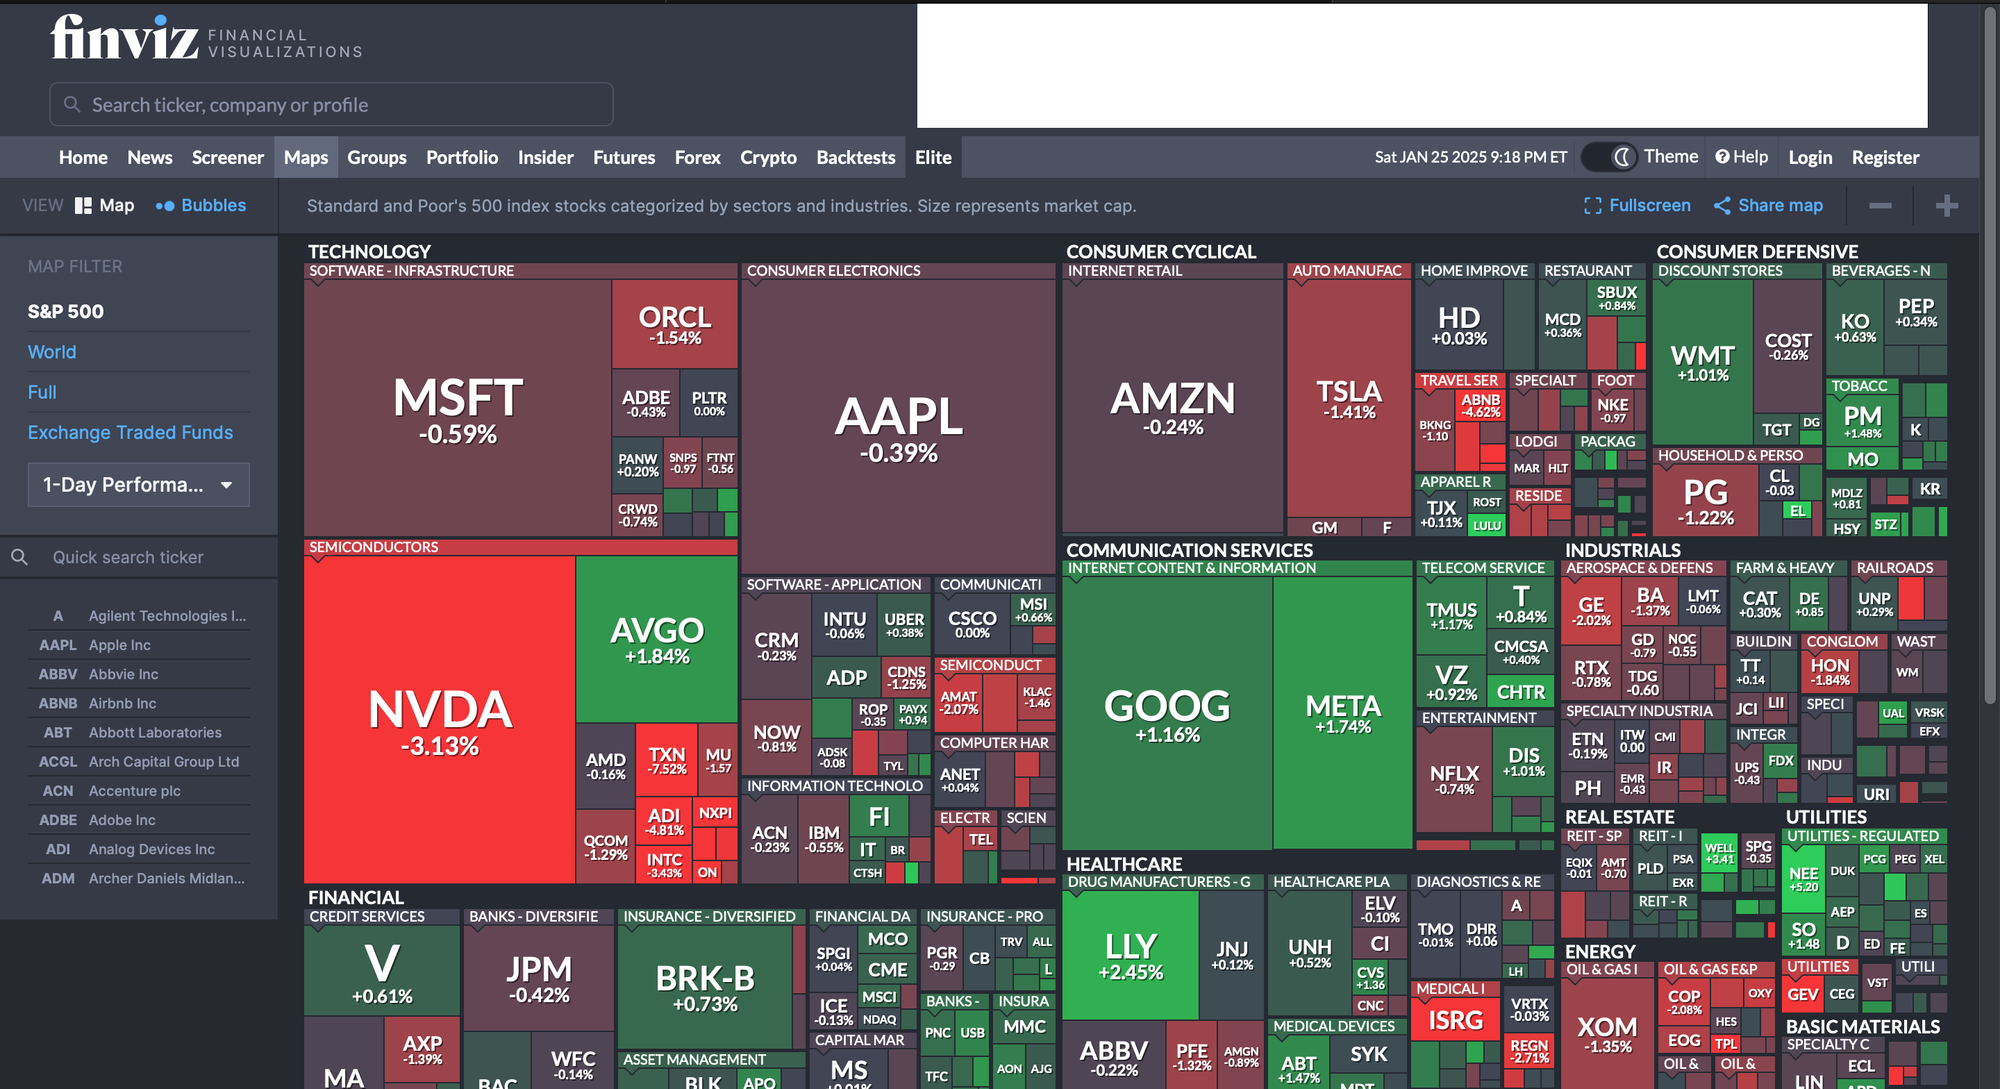
While platforms like TradingView excel in providing detailed, real-time technical analysis for active traders, Finviz takes a different approach by offering a broader, macro-level view of the market. Finviz helps users evaluate the broader economic and market landscape, making it an invaluable tool for those focused on fundamental analysis and long-term strategies.
- Heat Maps & Sector Analysis: Finviz’s heat maps visualize stock performance across sectors, industries, and individual stocks. These heat maps provide a quick overview of how different market segments are performing, helping investors spot sector leaders or laggards. This feature is invaluable for trend analysis and identifying emerging market opportunities or risks.
- Comparative Stock Analysis: The platform allows users to compare multiple stocks or sectors, enabling portfolio diversification strategies. By evaluating metrics like P/E ratios, earnings growth, and other financial data, investors can make informed decisions about which stocks to add to their portfolios.
- Trend Spotting: Finviz is particularly effective for identifying macro-level market trends, making it useful for long-term investors or those interested in fundamental analysis. It helps investors gauge the health of the overall market and make decisions based on broader trends rather than minute-by-minute data.
StockNews.AI
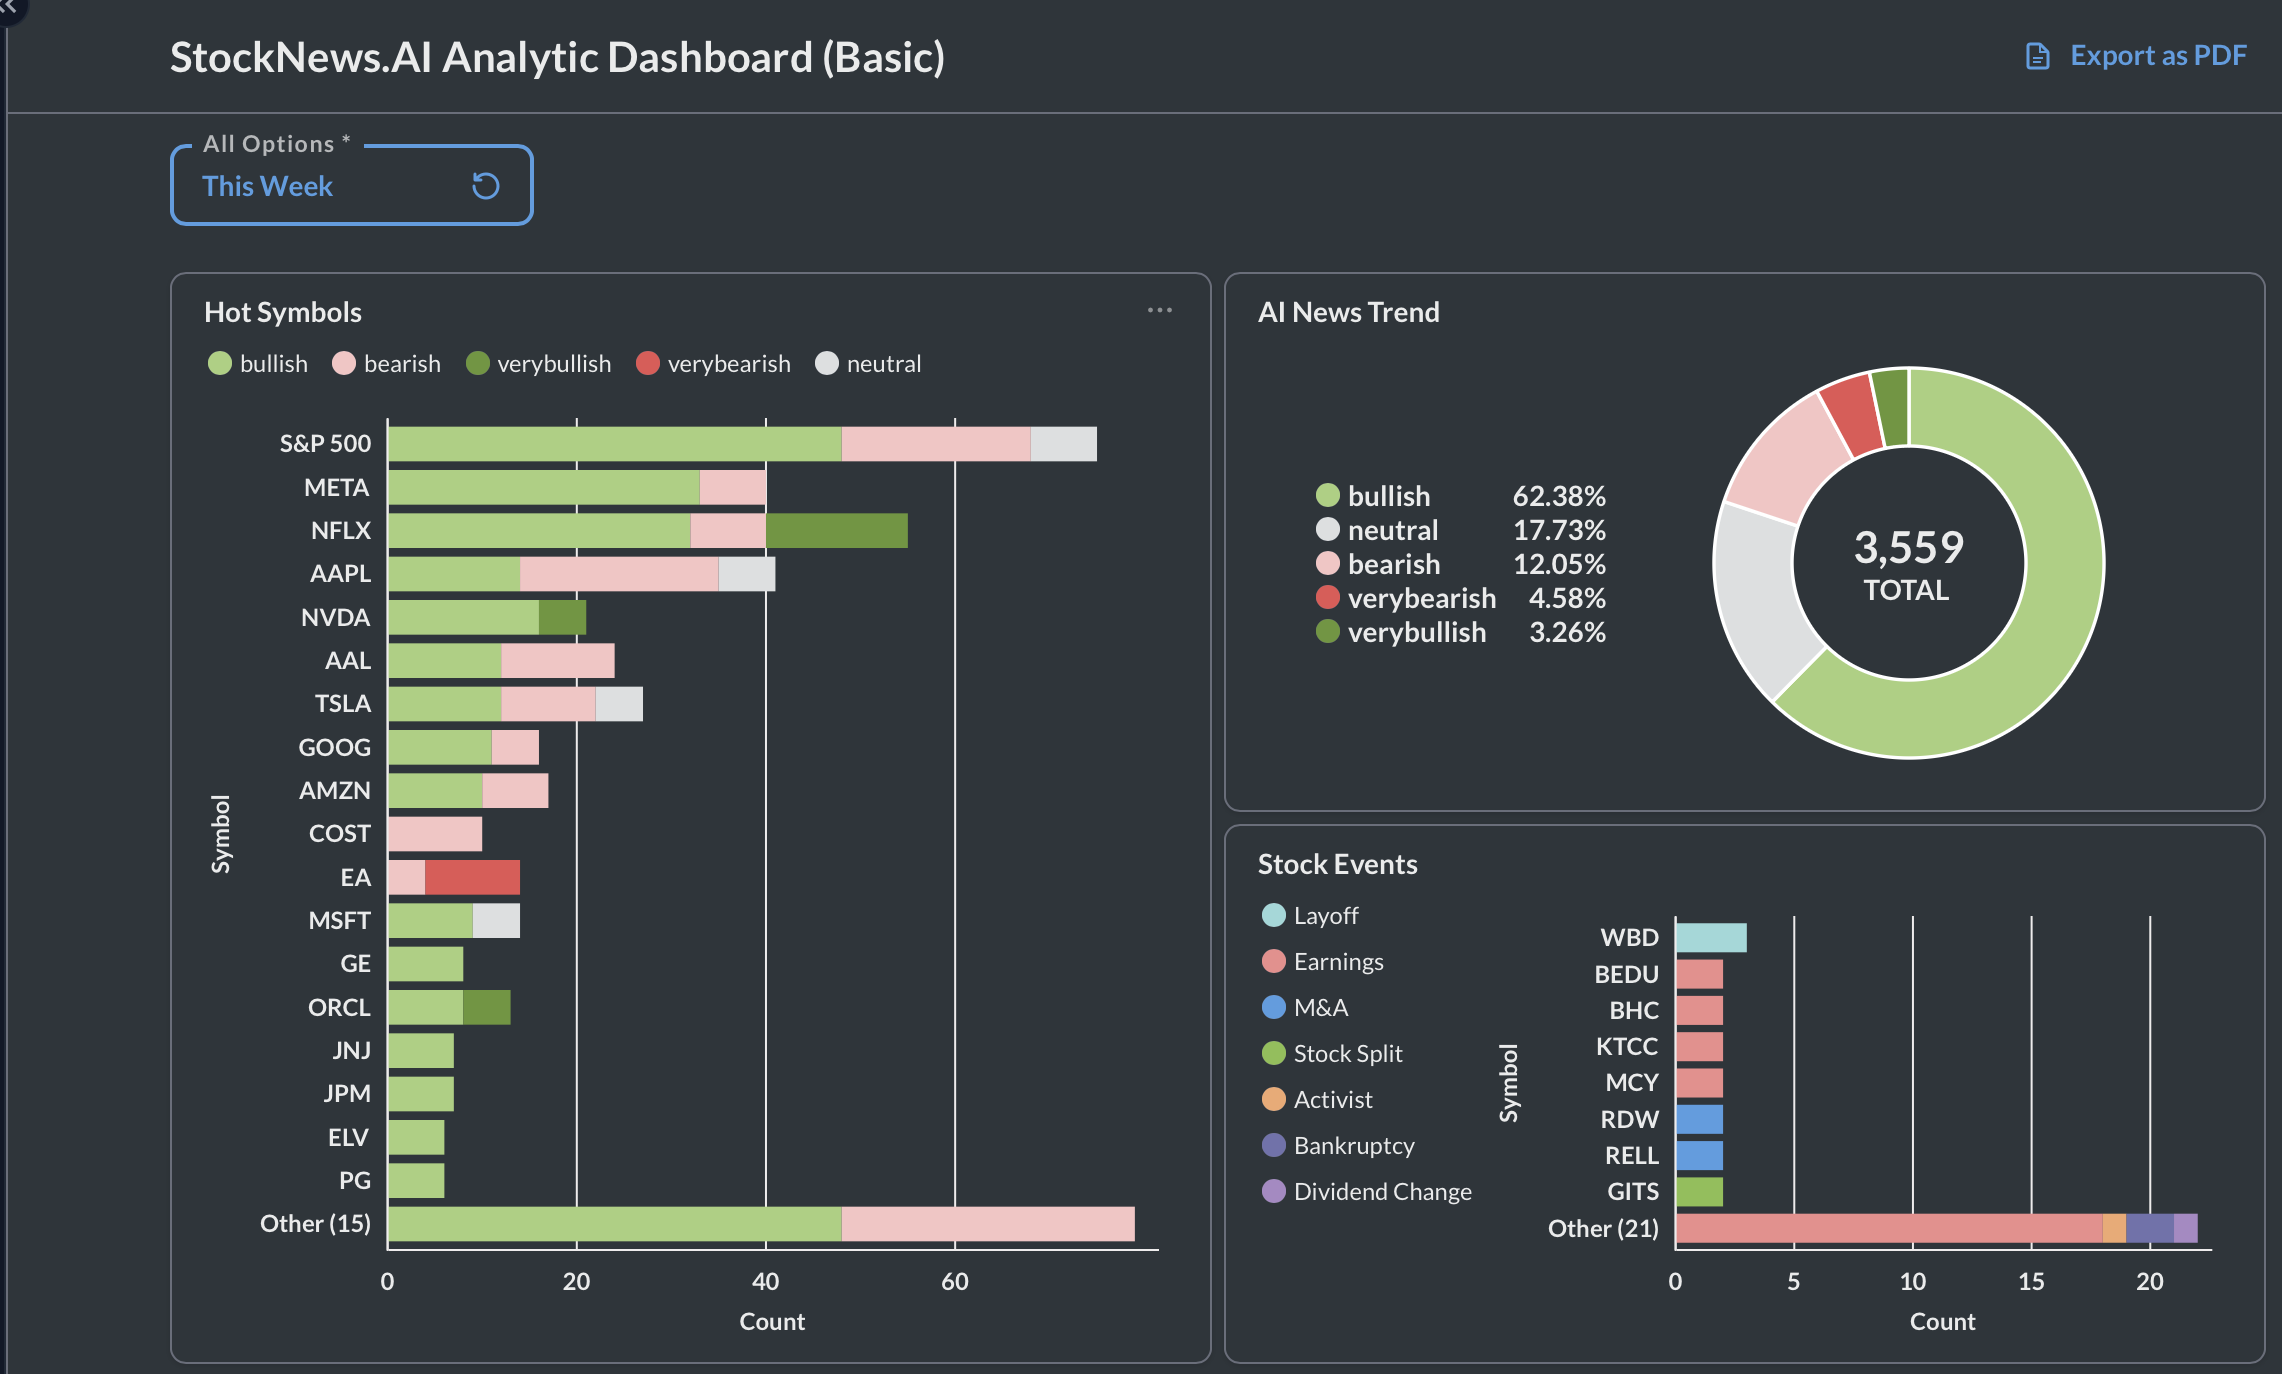
While platforms like TradingView and Finviz focus on price movements, technical charts, and sector analysis, StockNews.AI takes a different approach by integrating artificial intelligence and sentiment analysis to deliver a unique, data-driven experience for investors. StockNews.AI goes beyond traditional data visualization to track real-time market sentiment and news events, providing investors with additional layers of insight to make more informed decisions.
- Hot Symbols & News Tracking: StockNews.AI’s dashboard enables users to identify the most talked-about stocks in real time. This is based on an algorithm that aggregates headlines from major financial news sources. This feature allows investors to discover emerging trends or stocks receiving significant media attention, which could indicate future growth potential or risks.
- News Trend Analysis: StockNews.AI offers powerful trend analysis by tracking news topics and their correlation with stock price movements. By analyzing patterns between financial news and stock performance, investors can gain a better understanding of how certain news stories—whether related to earnings, mergers, or regulatory changes—impact stock prices. This allows investors to adjust their strategy and make proactive decisions based on actionable information.
- Spotting High-Impact Stock Events: StockNews.AI specializes in identifying key events that influence stock performance. Whether it’s an earnings report, product launch, or geopolitical development, StockNews.AI helps investors stay ahead by pinpointing the news stories driving stock movements. This feature is particularly beneficial for event-driven investors looking for stocks poised for significant price movements.
Summary
Dashboards are essential tools for stock investors, providing real-time, consolidated data in an easy-to-understand format. They enable quick decision-making by visualizing key metrics like stock prices, portfolio balance, and market trends. With features like real-time updates, personalized views, and alert systems, dashboards help investors stay on top of market movements, reduce emotional decision-making, and make data-driven choices. Ultimately, they streamline investment strategies, increase efficiency, and support better portfolio management.
The following comparison table highlights the key features and differences between popular stock investment platforms, helping investors choose the tool that best fits their needs and investment strategies.
| Feature | Google Finance | TradingView | Finviz | StockNews.AI |
|---|---|---|---|---|
| Core Focus | Real-time market data, financial news, portfolio tracking | Real-time technical analysis, stock pricing, trading volume | Macro-level market overview, sector analysis, fundamental analysis | Sentiment analysis, real-time news tracking, AI-driven insights |
| Real-Time Data | Yes, including stock quotes, currency conversions | Yes, including stock, commodities, forex, cryptocurrencies | Yes, but focuses on broader market trends | Yes, especially focused on hot stocks and events |
| Portfolio Tracking | Yes, with customized balance tracking over time | No, but can create watchlists and alerts | No, focuses on sector and stock analysis | No, focuses on news sentiment and stock events |
| Key Visualization Tools | Portfolio balance over time, real-time stock charts | Candlestick charts, customizable dashboards, watchlists | Heat maps, comparative stock analysis, trend spotting | Hot symbol tracking, news trend analysis |
| Target Audience | Retail investors looking for basic tracking tools | Active traders looking for in-depth technical analysis | Investors focused on long-term strategies and sector trends | Event-driven investors focused on sentiment and news |
| Alert System | No specific alerts, but tracks portfolio performance | Price alerts for stocks, sectors, or indices | No alert system, but offers filters for stock comparison | News event tracking and real-time alerts for high-impact stories |
| Access to Features | Free access to most features | Free and paid plans, with more advanced tools in paid versions | Free access, with advanced features in premium plans | Primarily paid, with some limited free features |
| Best For | Beginners and those seeking simple tracking | Active traders and technical analysts | Long-term investors, portfolio managers | Investors seeking to capitalize on news events and sentiment |